
Table of Contents
If you’ve tried to instrument an application using OpenTelemetry you may have found it hard to know where to start, or to know if you are following good practices. The OpenTelemetry ecosystem is large and no one person can know all of the features and contraints.. wouldn’t it be good to have a helper?
Recently Sasha Sharma from Honeycomb.io posted this article where they discussed how it’s not always easy to get started with OpenTelemetry, which lead to them to create a lightweight MCP Server to help with OpenTelemetry instrumentation.
Adriel Perkins then took the concept further as described in this post, and created this repo here https://github.com/liatrio-labs/otel-instrumentation-mcp.
This MCP server provides the following:
Real-time access to OpenTelemetry repositories, documentation, examples, semantic conventions, and the instrumentation score specification to help engineers implement high-quality observability in their applications.
The use of this work should then in theory bring the following benefits:
Improved clarity on when to use different instrumentation components
Surfacing if any unusual behavior is related to documented known issues
Navigating the complexity of OpenTelemetry documentation
Providing accurate, up-to-date instrumentation code
Following best practices and semantic conventions
Generating instrumentation that scores qualitatively high
Avoiding common pitfalls and anti-patterns
So, let’s take this MCP server for a spin and see how it works. First though, I always like starting with some definitions:
Glossary
OpenTelemetry
OpenTelemetry is a collection of APIs, SDKs, and tools. Use it to instrument, generate, collect, and export telemetry data [ref]
💡Note: OpenTelemetry itself is not however a backend analytics platform, you still need a data destination e.g. Honeycomb (covered later).
Observability
Observability is the concept of gaining an understanding into the behavior and performance of applications and systems. This is accomplished by collecting and analyzing telemetry data, such as traces, logs, and metrics. Observability is used to diagnose issues, gain an overview of the interconnectivity of dependencies, and monitor reliability. Observability has become an increasingly critical element in software development as systems and applications become more complex. [ref]
MCP
MCP (Model Context Protocol) is an open-source standard for connecting AI applications to external systems. Using MCP, AI applications like Claude or ChatGPT can connect to data sources (e.g. local files, databases), tools (e.g. search engines, calculators) and workflows (e.g. specialized prompts), enabling them to access key information and perform tasks. [ref]
For more definitions see these Glossaries:
Prerequisites
Before you begin, ensure you have:
Python 3.12+ installed
Node.js 18+ for MCP Inspector
A GitHub account
A Honeycomb account (free tier available)
An IDE with MCP support (Cursor, VSCode with extension, or Claude Desktop)
MCP Server setup
We will follow the instructions from here https://github.com/liatrio-labs/otel-instrumentation-mcp
💡Note: this isn’t MCP Server code that you pull into your own app project folder, this is separate code which then you’ll configure then run independently from your running application code. While you are then coding your application project, your IDE will reach out and start this MCP server to give you instrumentation advice and actions.
Clone the repo
git clone https://github.com/liatrio-labs/otel-instrumentation-mcp.git
cd otel-instrumentation-mcp
Install uv
uv is a modern python utility which helps with a bunch of python tasks [see here for more info]. You will find instructions specific to your operating system here. Python is used by the FastMCP framework in this solution.
Install dependencies
uv syncGithub Authentication
Your MCP server will need to query the Github GraphQL API in order to read data from the OpenTelemetry organisation repositories and the instrumentation-score spec, and to do this it will need to be authenticated and authorised. You’ll give permission to the MCP server to use your own Github account security context, in a way that will adhere to a Least Privilege model. In this case we’ll create Classic Github Personal Access Token.
Login to github.com
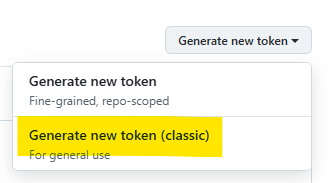
Navigate to https://github.com/settings/tokens
Choose Generate new token (classic)
Choose a name and an Expiration date [ and make a note of the date so you are not confused when it breaks on that date :😊]
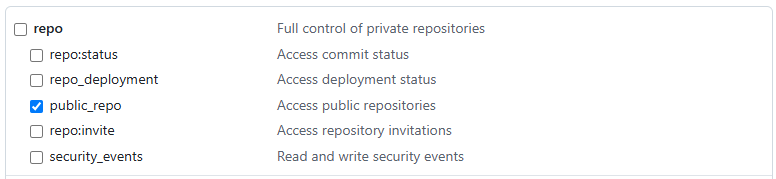
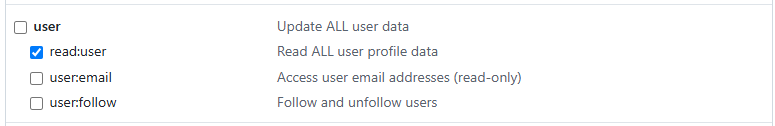
Ensure you follow the principle of Least Privilege when creating your token, chosing only the permissions listed here:
Click Generate Token and then copy the resulting token text to your favourite password manager.
💡Tip: I also like to store in the password manager a link to the documentation I am following, so I have some context to re-hydrate my brain when the token needs renewing.
Once you are done it will look similar to this in the Github UI.


💡!! Security Note: Treat this token like a password. Never commit it to version control. For production use, consider GitHub Apps
IDE Creds and configuration
We need to make this token available to our running MCP code, and for now we’ll do this manually prior to starting our MCP server. In your IDE terminal export your token, making sure you updated the value below with your token value
export GITHUB_TOKEN="YOUR_TOKEN_HERE"
This will create an environment variable for the duration of your session. There are more robust methods to manage this process in a production setting, and in particular make sure you read the section ‘Option B: GitHub App’ in the repo for production use.
Honeycomb Setup
We need a credential that the MCP server can use to send its telemetry data to Honeycomb. Setup a free account with Honeycomb via https://ui.honeycomb.io/signup
API Keys exist within the context of an Environment, so Browse to Manage Data | Environments

Select the automatically created environment which is labelled Test, or click Create Environment to create a new one.
Click Create Ingest API Key

Give it a sensible name, enable the checkbox to allow the creation of services/datasets, and Click Create

💡Tip. I like to add the creation date to the key name as a habit, and future you will thank you if you ever have to manage renewal or deletion of hundreds of keys
The key value will be displayed, and you should now copy this to your favourite password manager. Note that this key will only be displayed once.

Honeycomb docs for keys are here
O11y of the O11y
This MCP code has been configured so that the MCP server itself is observable. This o11y data needs to go somewhere so in this example let’s send it to Honeycomb.io. (In future blog posts we’ll setup a local collector and I’ll document how that works.)
The mechanism to do this is to configure the environment variable OTEL_EXPORTER_OTLP_ENDPOINT. While we are at it, let’s also export our new Honeycomb API key [replacing the word YOUR_TOKEN_HERE with your key value]
export OTEL_EXPORTER_OTLP_ENDPOINT=https://api.honeycomb.io:443
export OTEL_EXPORTER_OTLP_HEADERS=x-honeycomb-team=YOUR_TOKEN_HERE
💡Also review the supplied .env.examples file for other configuration options
Start the MCP Server
Now lets run our new MCP server using uv
uv run otel-instrumentation-mcp
You’ll see this ‘splashscreen’ displayed

and your output will be similar to this

If you now view the Honeycomb dashboard you should see a new dataset called otel-instrumentation-mcp-server. This new dataset exists because when we created the API key we enabled the checkbox allowing the creation of datasets. You’ll also soon receive an email notifying you of this dataset creation.

The dataset is named this from this line in the code:
self.service_name = os.getenv("SERVICE_NAME", "otel-instrumentation-mcp-server")
You can also override this using the SERVICE_NAME environment variable
You’ll also see a single trace from the initialize event

If you want to do a manual test of this running instance you could install MCP Inspector
npx @modelcontextprotocol/inspector uv run otel-instrumentation-mcp
Need to install the following packages:
@modelcontextprotocol/[email protected]
Ok to proceed? (y)
This will start a browser window where you can connect to your MCP server and ask questions. Just click Connect

Click on Tools | List Tools and you’ll see a list of options related to OpenTelemetry

Click on a tool, for example get_opentelemetry_examples

Click Run Tool and your MCP server will reach out and retrieve this content.

💡Note: This just demonstrates that the MCP Server is functioning. Your interaction with it will be via your IDE when you are developing your application and using the IDE connection to this MCP server.
So far so good, we have a running MCP server which knows about where to get current information about OpenTelemetry.
We can now stop this MCP server as it will usually be called and started as needed during app development. For this to work we need to configure our IDE to know about this MCP resource.
MCP Configuration in your IDE
Close this project and open your application code project. In my case I’m using Cursor IDE, so MCP server settings can be accessed via File | Preferences | Cursor Settings , then click Tools & MCP

You’ll see that you can add a global setting file, or configure it per project. Have a look at the example in the repo here: Readme
There were several hoops to jump through to get this working:
I needed to escape my file path backslashes in the JSON due to having backslashes in windows folder paths.
Cursor MCP config seems to struggle if it gets too complex, so I moved the complexity to an external powershell file, then called that from with mcp.json
I added tokens as windows user environment variables [using setx], then referenced them in the powershell file. My initial version using a batch file was not as robust in getting the environment variable values passed through to the MCP server. IDE restart required after environment variable addition.
There is a character limit of 60 for a tool name length, so this will need to be resolved upstream of this solution.
Resulting mcp.json
{
  "mcpServers": {
    "otel-instrumentation-mcp": {
      "command": "powershell",
      "args": [
        "-ExecutionPolicy",
        "Bypass",
        "-File",
        "D:\\Marty\\Code\\otel-instrumentation-mcp\\start-mcp-server.ps1"
      ],
      "cwd": "D:\\Marty\\Code\\otel-instrumentation-mcp"
    }
  }
}
Powershell file content
$env:GITHUB_TOKEN = [System.Environment]::GetEnvironmentVariable("GITHUB_TOKEN", "User")
$env:OTEL_EXPORTER_OTLP_ENDPOINT = [System.Environment]::GetEnvironmentVariable("OTEL_EXPORTER_OTLP_ENDPOINT", "User")
$env:OTEL_EXPORTER_OTLP_HEADERS = [System.Environment]::GetEnvironmentVariable("OTEL_EXPORTER_OTLP_HEADERS", "User")
cd "D:\Marty\Code\otel-instrumentation-mcp"
& "C:\Users\marty\AppData\Roaming\Python\Python313\Scripts\uv.exe" run otel-instrumentation-mcp
This then allowed the MCP server to start:

💡Make sure you restart your IDE after making changes to the MCP config
Summary
😀 Tada! We now have a local MCP server that allows your IDE to be an OpenTelemetry-aware development environment. As you develop your apps you'll have instant access to instrumentation patterns, semantic conventions, and best practices.
What we need next is an application to try this out on…
Next Article: The Sample App
In the next post, I'll introduce ShopTelemetry, a microservices based e-commerce application I've built specifically for demonstrating OpenTelemetry instrumentation patterns. It is functionally just a simple web store app where users can search for products, add items to a cart, complete their order, and see status updates.
Architecture:
5 microservices (user, product, cart, order, notification)
Built with vanilla JavaScript
Serverless framework + LocalStack (simulating AWS)
Running locally in Docker Desktop

In future articles I’ll migrate this app to AWS ECS, and then to AWS EKS to see how our Instrumentation approach might vary.
What you'll learn:
Adding instrumentation to a real application
Working with the MCP server during development
Viewing telemetry in Honeycomb
Common instrumentation patterns and pitfalls
Preview

Order Status Summary

This article is long enough for now, so in the next episode we’ll walk through using our new OpenTelemetry MCP Server to start instrumenting our app then viewing the results in Honeycomb.
Make sure to sign up to the newsletter to get notified of each blog post in this series, and please share this post if you know someone who would find it useful.
Thanks for reading and I’ll see you in the next one 😊
Marty Lindsay
Contract Solution Architect / Observability Specialist
Website: https://www.marty.co.nz
Bluesky: https://bsky.app/profile/marty.co.nz
Photo Credit: Marty Lindsay, Queenstown hill, Queenstown, New Zealand